Retrospective Authorization Approval Rates by Payer and Drug Class
New CMS data reveals payer-by-payer prior authorization denial rates, though drugs remain excluded.
Retrospective Authorization Approval Rates by Payer and Drug Class.
Why retrospective authorization denials hit infusion practices differently
A denied claim in most of medicine means a delayed payment, an annoying phone call, maybe a resubmission. In infusion, it means the practice already bought the drug, already infused it, and now has nothing to show for the cost on its books. That distinction matters more than most billing teams give it credit for.
The exposure per encounter is not trivial. Biologics and high-cost oncology agents can run into the tens of thousands of dollars per dose, and when a payer reverses course after the fact, that is not a rounding error in the AR aging report.
Retrospective denials are a specific animal. A payer grants prior authorization, the practice proceeds in good faith, and then, after reviewing the medical records, the insurer reverses its own earlier decision. Some payer contracts even spell this out in plain language, stating that prior authorization is not a guarantee of payment. That single clause shifts an enormous amount of risk onto the provider, because the drug has already been administered and the cost already incurred by the time anyone gets to argue about medical necessity. Prospective denials happen before the money goes out the door. Retrospective ones happen after. Infusion practices treat them as a different category of problem entirely for this reason.
What CMS-0057-F requires payers to disclose
CMS finalized the Interoperability and Prior Authorization Rule, known as CMS-0057-F, back in January 2024, and the first public reports, covering calendar year 2025, came due on March 31, 2026. For teams that have been waiting for a way to hold payers accountable with actual numbers, that wait is finally over, at least in part.
The rule reaches a wide swath of the payer landscape. It covers Medicare Advantage plans at the contract level, state Medicaid and CHIP fee-for-service programs at the state level, Medicaid managed care plans, CHIP managed care entities, and Qualified Health Plan issuers on the federally-facilitated exchanges, reported at the plan or carrier level. The metrics required are approval rates, denial rates, decision turnaround times, and appeals outcomes.
Drugs are explicitly excluded from this reporting mandate. Everything the public data shows applies to medical items and services generally. So the transparency win applies to the surgical scheduler and the imaging center, but not yet to the infusion suite. That gap is the single most important caveat to carry into every conversation about what this new data can and can't tell a billing team.
Reading the publicly posted denial rate data as an infusion billing team
Start with the topline number, because it sets the baseline everyone is arguing against. In Medicare Advantage in 2024, insurers fully or partially denied 4.1 million prior authorization requests out of nearly 53 million total determinations, a 7.7 percent denial rate https://www.beckerspayer.com/policy-updates/payers-prior-authorization-denial-rates-go-public-5-notes/ https://www.247medicalbillingservices.com/blog/prior-authorization-best-practices-2026-reduce-denials-speed-up-coverage-decisions. That is the number that gets quoted in every trade press writeup, and it is accurate. It is close to useless for benchmarking a specific payer relationship.
A deeper cause produces the aggregate figures: national averages flatten out enormous plan-to-plan variation. National averages flatten out enormous plan-to-plan variation, and individual MA contracts, along with individual Medicaid managed care plans, show denial rates that differ materially from one another and from the headline aggregate national rate. Before March 2026, that variation existed but was invisible. Now it is sitting on a public website, contract by contract, waiting to be pulled.
Finding it is mechanical, if not exactly convenient. That is a genuinely new capability.
Then there is the appeal data, which might be the most underused number in the whole dataset. More than 80 percent of Medicare Advantage prior auth appeals are ultimately overturned https://www.beckerspayer.com/policy-updates/payers-prior-authorization-denial-rates-go-public-5-notes/. A plan with a high overturn rate is, in effect, admitting that its first-pass denials frequently don't hold up to scrutiny. For a billing team deciding where to spend appeal effort, that is not a subtle hint. It is close to a directive: appeal early, appeal often, and expect to win. Payers must post aggregated prior auth metrics on their public websites annually, and because MA reports at the contract level, practices can compare contracts within a payer.
Denial rates by drug class: what the clinical literature and billing data show where CMS reporting is silent
Since CMS reporting stops short of drug-level detail, the clinical and billing literature has to fill the gap, and the picture it paints is not comforting. Prior authorization denials overall climbed to around 31 percent in 2026, and much of that increase traces back to high-complexity specialty infusion and biologics specifically https://rcmworkshop.com/insights/blogs/from-chair-time-to-denial-prior-authorization-errors-collapse-infusion-billing/. Infusion is not just caught up in a general denial trend. It is driving a meaningful share of it.
Biologics for autoimmune and rheumatology conditions sit at the center of that trend. First-submission denial rates for these drugs and other disease-modifying agents run 25 to 40 percent, with a separate estimate putting biologics, oncology infusions, and high-cost autoimmune therapies at 20 to 35 percent https://qualigenix.com/prior-auth-for-medication-2026/ https://staffingly.com/insights/blog/medicare-advantage-prior-authorization-denials-are-up-56-what-providers-need-to-know-right-now/. Either range says the same thing: roughly a third of first attempts fail before anyone even gets to the retro auth stage.
Biosimilar-first policies have layered new complexity onto that already crowded field. Many payers now require a documented trial of, or contraindication to, a biosimilar adalimumab or infliximab before they'll cover the reference product. That is an entirely new documentation requirement that did not exist a few years ago, and missing it is an easy way to trigger a denial that has nothing to do with whether the drug itself was medically necessary. Step therapy compounds the problem further and remains one of the most consistent denial drivers in this category: denial rates of 25 to 40 percent are common for autoimmune biologics when step therapy documentation is incomplete.
IVIG carries its own particular risk profile, mostly because the paperwork changes depending on diagnosis. CIDP, primary immunodeficiency, ITP, and various neurology indications each come with a different documentation packet, and most plans want IgG level documentation, confirmed diagnosis, and evidence that alternative therapies failed, all bundled into one submission. Missing one element, or letting one go stale, spikes the retro auth risk.
Oncology brings a different flavor of complexity. Custom weight-based dosing and multi-drug regimens create J-code unit accuracy risk that sits on top of, not instead of, the prior auth risk. Virtually all biologic medications require prior authorization across commercial payers, MA, and Medicaid managed care, including TNF inhibitors (adalimumab, etanercept, infliximab, certolizumab, golimumab), IL-17 inhibitors (secukinumab, ixekizumab, brodalumab), IL-23 inhibitors, JAK inhibitors, and integrin inhibitors. Specific J-codes (J1569 [Gammagard Liquid], J1459 [Privigen], J1561 [Gamunex-C/Gammaked], and J1568 [Octagam]) may each have plan-specific formulary and PA treatment.
Retro auth denials often trace back to intake and authorization lifecycle gaps, not clinical inappropriateness
A denial letter almost always frames itself as a clinical judgment. Read closely, a large share of retro auth denials turn out to be administrative failures rather than clinical disagreements. They're administrative failures that happened long before anyone reviewed a chart.
Experian Health's 2025 State of Claims data found that 26 percent of respondents traced at least one in ten of their denials back to intake errors, things as basic as a wrong policy number, an outdated insurance card, or a missed eligibility recheck https://vigilantbillingms.us/outsourcing-home-infusion-billing-services/. None of that has anything to do with whether the drug was appropriate for the patient. It has everything to do with whether someone typed the right number into the right field, given that retro auth reversals, expiration denials, and documentation denials each stem from different root causes requiring different corrections.
Authorization expiration deserves its own callout, because it is a structural vulnerability baked into how infusion therapy works. A service delivered after an authorization has expired gets treated exactly the same as a service delivered with no authorization at all: a full denial, no partial credit for the fact that approval existed at some point. For a one-time procedure, that risk is a single point of failure. Each renewal is another chance for the clock to run out unnoticed.
The fix here is not complicated, which almost makes it more frustrating when it gets skipped. Re-authorization requests should go out at least two weeks before the current authorization expires, and the strongest version of this practice builds automated alerts into the scheduling system at 30, 14, and 7 days out. That is a scheduling discipline problem, not a clinical documentation problem, and it is entirely within a billing team's control to solve.
Shaping payer-specific retro auth recovery strategy using appeal overturn data
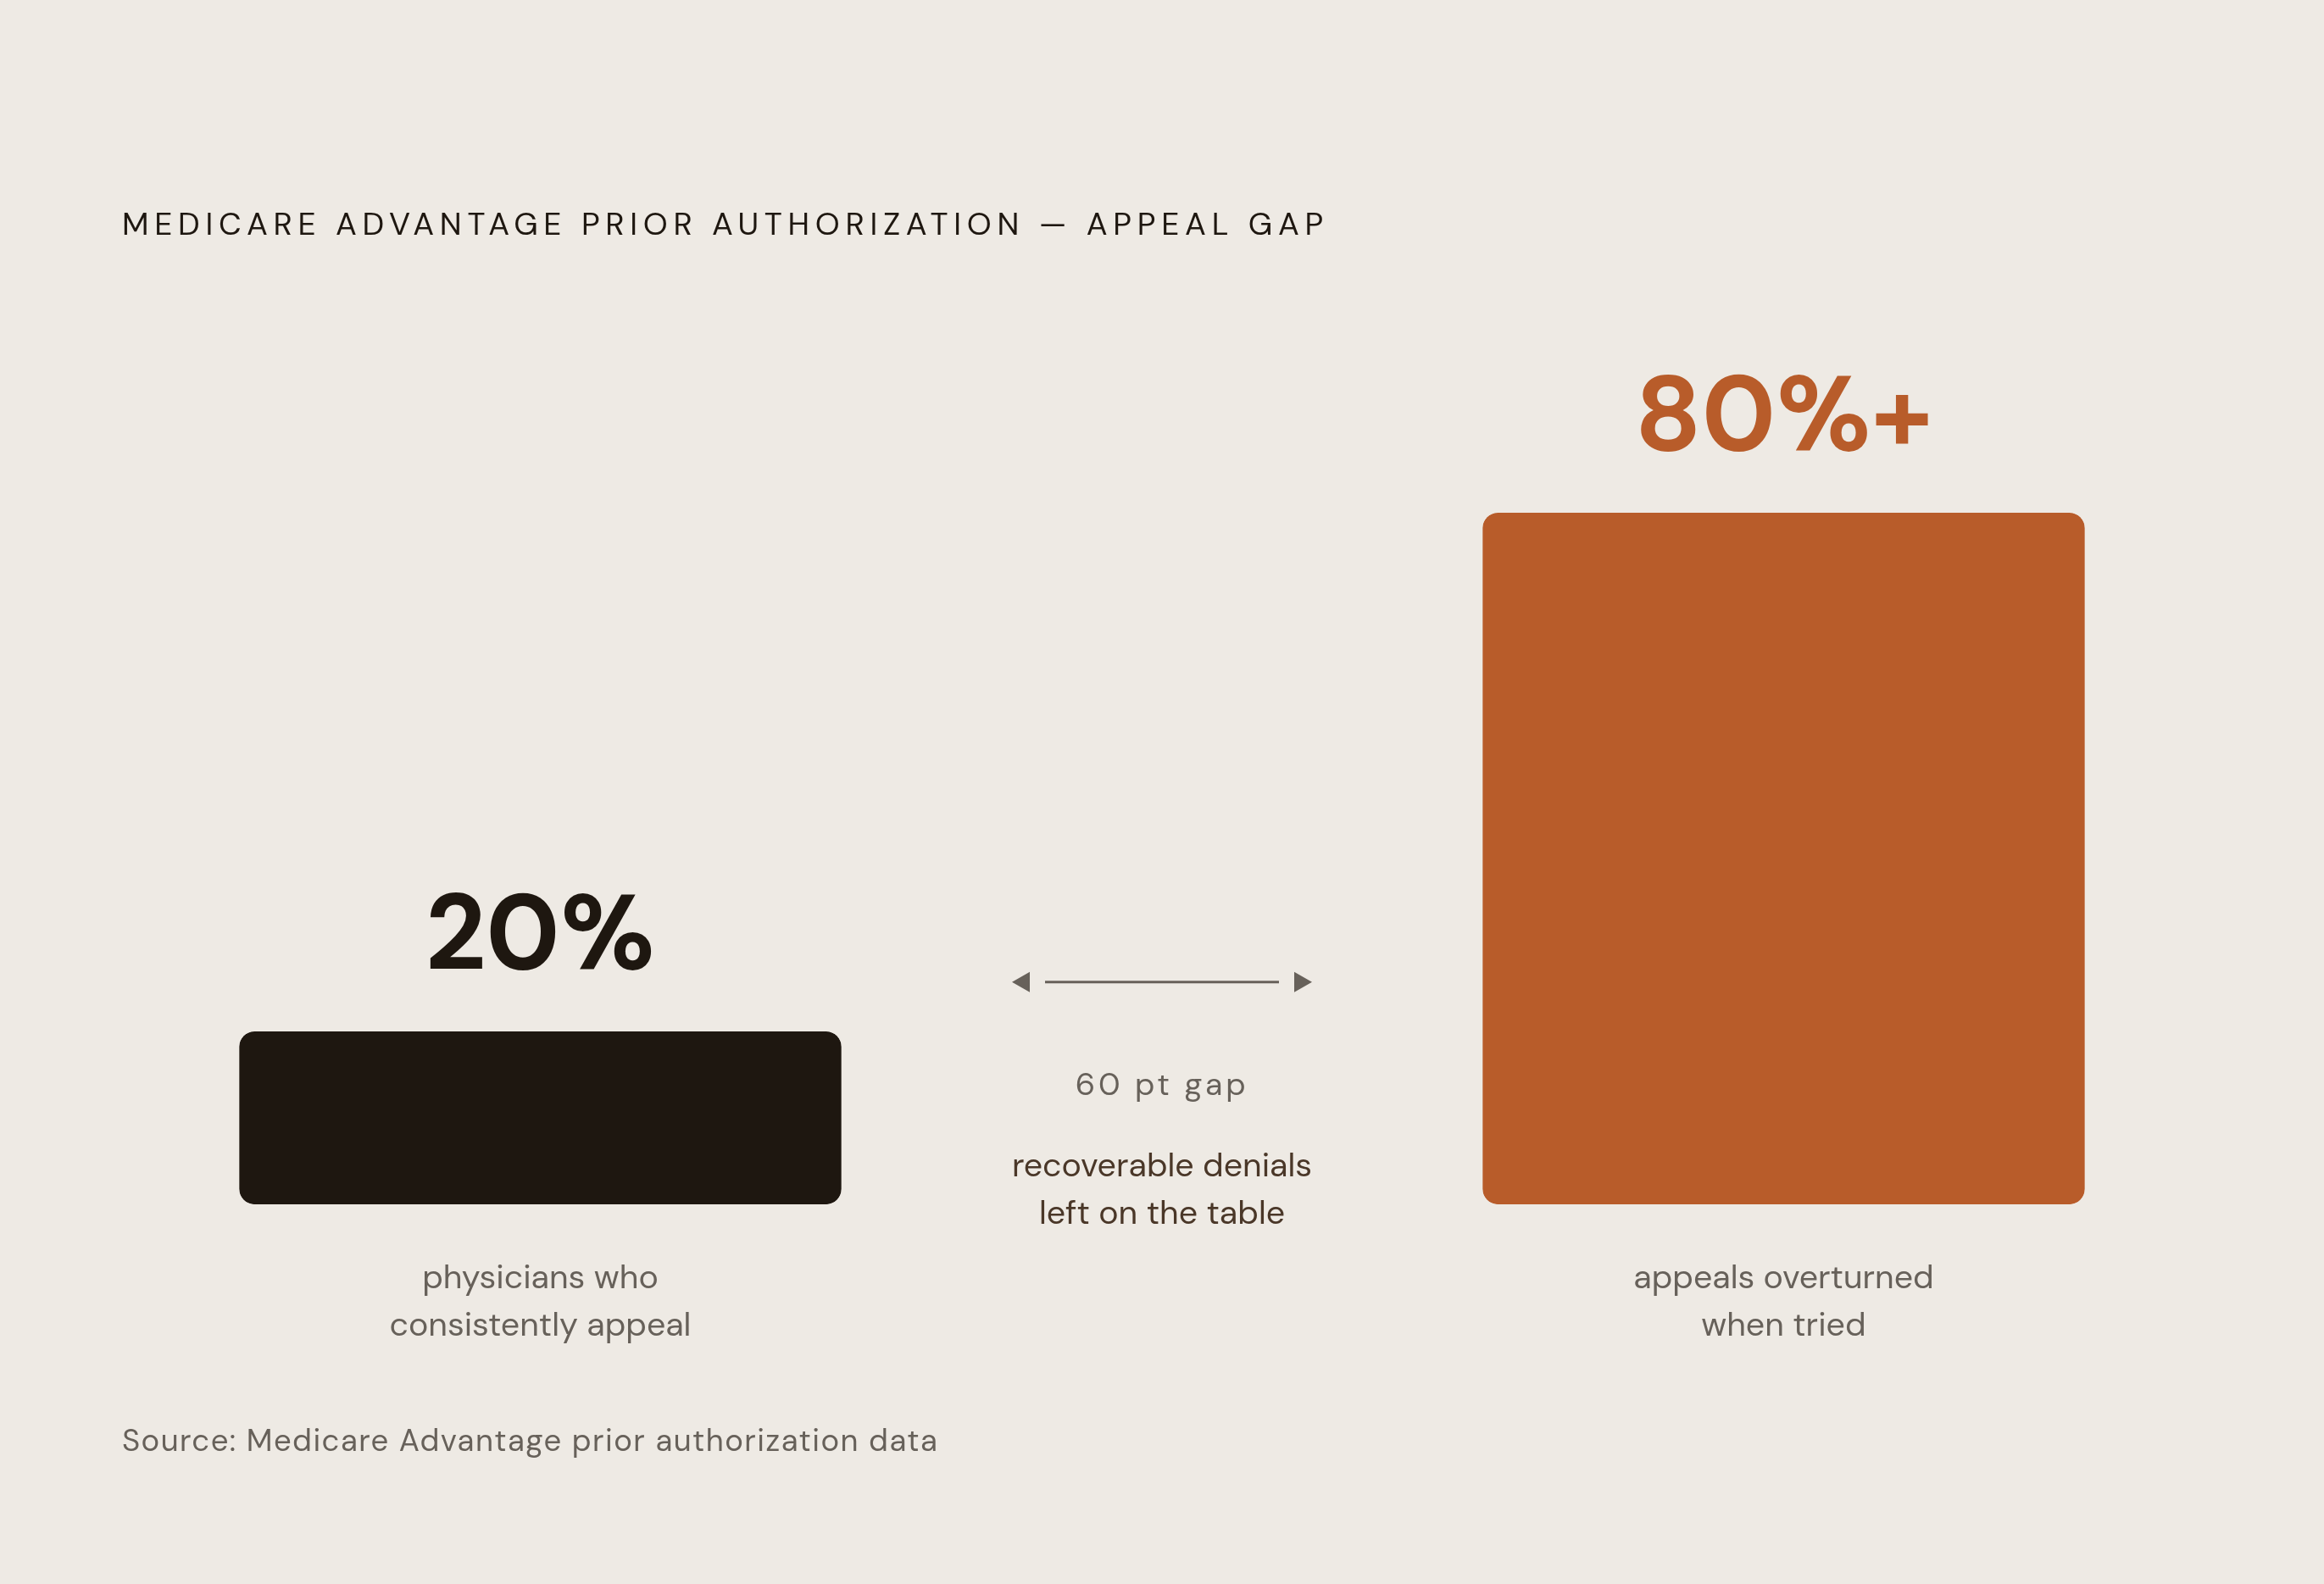
The gap between what could be recovered and what actually gets recovered is enormous, and the numbers make that gap impossible to ignore. Do the arithmetic on that and the conclusion is blunt: the large majority of recoverable denials are simply being written off because nobody filed the appeal.
That overturn rate is now a public, payer-specific data point that should function as a direct instruction to billing teams. A plan publishing a high overturn rate is telling the market, in effect, that its initial denials frequently don't survive scrutiny. Against that plan, the strategy is straightforward: appeal aggressively, appeal early, and treat the first denial as an opening move rather than a final answer.
A plan with a low denial rate paired with a low overturn rate is a different animal. That combination signals a payer whose initial denials are more clinically defensible, meaning appeal volume alone won't move the needle much. The better strategy there is tightening the initial submission: stronger documentation up front, not more paperwork after the fact.
None of this works if denial data gets lumped together generically. Denial patterns are payer-specific and root-cause-specific, and grouping them into one undifferentiated bucket hides exactly the signal a billing team needs to fix anything. The public reporting mandate is what makes this kind of plan-by-plan segmentation possible for the first time since March 2026, and treating it as a generic denial rate rather than a set of distinct payer behaviors wastes the entire point of the disclosure. More than 80% of MA prior auth appeals are ultimately overturned, yet only about 20% of physicians consistently appeal adverse decisions, so the majority of recoverable denials are being written off without appeal.
Voluntary payer reductions and gold-carding laws and their effect on retro auth exposure going forward
Insurers have been making public commitments to cut back on prior authorization, but the numbers behind those commitments should not be taken at face value. Medicare Advantage alone saw a reduction of more than 15 percent over that same window https://www.beckerspayer.com/policy-updates/cms-proposes-extension-of-prior-authorization-rule-to-cover-drugs-6-notes/.
Those are real numbers, and they matter. But infusion billing teams shouldn't read them as a sign that specialty drug scrutiny is loosening. The reductions concentrate in lower-complexity service categories, the kind of routine, lower-cost items where prior auth was arguably overkill to begin with. Biologics and specialty infusion drugs remain among the categories where payers keep the strongest financial incentive to scrutinize every claim. Assuming that infusion drug PA volume is declining in step with the broader trend is a mistake that will appear in a future denial log, not in this quarter's optimism.
Gold-carding laws offer a more direct, more structural form of relief, at least for the providers who qualify. Six states currently have gold-carding statutes on the books: Texas, Louisiana, Arkansas, Colorado, Montana, and West Virginia. These laws exempt providers with consistently high PA approval rates from the prior authorization requirement entirely, for qualifying services. Texas sets the bar at a 90 percent approval rate over a one-year look-back period, with a minimum of five requests to qualify, giving practices a concrete target to build toward https://www.careroute.ai/blog/prior-authorization-denied. That is a concrete incentive. It is a concrete target a practice's authorization team can build toward, track against, and eventually use to get out of the prior auth cycle altogether for the services that meet the threshold. Nearly 50 insurers pledged prior auth reductions in June 2025, and an AHIP–Blue Cross Blue Shield Association survey found insurers have eliminated 11% of prior authorization requirements since June 2025, representing 6.5 million fewer prior authorizations.
Building a payer-specific retro auth benchmarking process from the data now available
None of this data does anything sitting in a PDF on a payer's website https://www.cms.gov/medicare/payment/fee-for-service-providers/home-infusion-therapy/billing-and-rates. It has to get pulled, cross-referenced, and acted on, and that process breaks down into four steps that build on each other.
The data covers approval rates, denial rates, appeal outcomes, and turnaround times for medical items and services, remembering always that drugs are excluded from this round of reporting.
Step two is cross-referencing that external data against the practice's own internal denial log, sorted by payer and by drug class. The public data shows how a payer behaves in general. The internal log shows where a specific practice's retro auth denials are actually landing, drug by drug. The overlap between those two datasets is where the highest-priority recovery targets live, and it is a different list for every practice, because every practice's drug mix and payer mix is different.
Step three is segmenting those internal denials by type and root cause: retro auth reversals, expiration denials, and documentation denials each require a different correction. Retro auth reversals, where a payer walks back an authorization it already granted, expiration denials, where the auth lapsed before treatment happened, and documentation denials, where the records were judged insufficient on review, are three distinct failure modes. Each one needs a different fix. Fixing a documentation gap does nothing for an expiration problem, and vice versa, so lumping them together defeats the purpose of tracking them.
Step four is prioritizing appeal effort using the overturn rate data specifically. Plans publishing high overturn rates justify a systematic, aggressive appeal posture, since the data itself argues that the initial denials are frequently wrong. Plans publishing low overturn rates are sending the opposite message: the fix there is raising the documentation standard on the front end, because appeals aren't going to bail out a weak initial submission. Step 1 is to locate and download plan-level public reports (MA contracts on payer websites, Medicaid managed care at the state level, and ACA plans at the carrier level), covering approval rates, denial rates, appeal outcomes, and turnaround times for medical items and services, with drugs excluded for now. Infusion services are expected to grow by a compound annual growth rate of 8 to 10 percent through 2026 https://lrvhealth.com/insights/the-changing-landscape-of-the-infusion-market. Eleven infusion therapy platform deals were announced in 2024, significantly more than 2023 and 2022 combined https://www.healthfmv.com/post/infusion-therapy-valuation-guide. In Medicare Advantage in 2024, insurers fully or partially denied 4.1 million prior authorization requests https://www.beckerspayer.com/policy-updates/payers-prior-authorization-denial-rates-go-public-5-notes/. Insurers have eliminated 11 percent of prior authorization requirements since June 2025 https://www.beckerspayer.com/policy-updates/cms-proposes-extension-of-prior-authorization-rule-to-cover-drugs-6-notes/. The elimination of 11 percent of prior authorization requirements since June 2025 represents 6.5 million fewer prior authorizations https://www.beckerspayer.com/policy-updates/cms-proposes-extension-of-prior-authorization-rule-to-cover-drugs-6-notes/. Medication-related denials represent nearly 20 percent of outpatient claim rejections nationwide https://www.247medicalbillingservices.com/blog/drug-infusion-billing-errors-in-2026-j-codes-modifiers-asp-ndc-mismatches. Only about 20 percent of physicians consistently appeal adverse prior authorization decisions https://www.247medicalbillingservices.com/blog/prior-authorization-best-practices-2026-reduce-denials-speed-up-coverage-decisions. For practices that adapt their workflows to new prior authorization rules, denials can be reduced by 40 percent or more https://www.247medicalbillingservices.com/blog/prior-authorization-best-practices-2026-reduce-denials-speed-up-coverage-decisions. Carriers that moved to electronic prior authorization workflows early saw authorization volume increase 12 to 18 percent in the first year https://www.247medicalbillingservices.com/blog/prior-authorization-best-practices-2026-reduce-denials-speed-up-coverage-decisions. The Medicare Advantage denial rate in 2024 was 7.7% https://actuary.info/insights/cms-prior-auth-metrics-public-denial-rates-health. Effective January 2026, expedited prior authorization decisions must be made within 72 hours https://actuary.info/insights/cms-prior-auth-metrics-public-denial-rates-health. Effective January 2026, standard prior authorization decisions must be made within seven calendar days https://actuary.info/insights/cms-prior-auth-metrics-public-denial-rates-health.
Sources
- Payers' prior authorization denial rates go public: 5 notes - Becker's Payer Issues | Payer News
- Prior Authorization Best Practices 2026
- CMS proposes extension of prior authorization rule to cover drugs: 6 notes - Becker's Payer Issues | Payer News
- CMS Prior Auth Metrics Go Public: Denial Rates, Processing Times, and Actuarial Pricing Impact
- From Chair Time to Denial: Prior Authorization Errors Collapse Infusion Billing - rcmworkshop
- staffingly.com
- qualigenix.com
- 247medicalbillingservices.com